
Each week, this column will take a critical look at key statistical trends to highlight pass rushing and tackle matchups to exploit and avoid. We'll be heavily relying on another great feature at FBG this season, the IDP Matchup Spreadsheet that will be generated by Larry Thomas. That spreadsheet will contain a number of weekly and weekly average statistical measures to help identify those defensive teams who are facing the best and worst opportunity as the season progresses. While this column will include two large tables of tackle and pass rush opportunity and matchup data, it's only a fraction of the data available in the spreadsheet. We hope that the Matchup Spreadsheet and this column will join John Norton's weekly IDP projections, Doug Drinen's Matchup Analyzer Tool and our customizable MyFBG function as useful tools to assist in making weekly line-up and waiver wire decisions.
Before we get to the hard data and matchup analysis, a quick explanation of the metrics we're using will probably be helpful. This column will be broken up into two primary sections - pass rushing matchups to exploit/avoid and tackle matchups to exploit/avoid. Each text section is followed by a table listing the relevant statistics and metrics driving our matchup decisions.
The pass rushing matchup table will include weekly averages of sacks, adjusted averages of sacks and quarterback hits and pass attempts faced. It will also have a column titled Pressure Applied, a metric we're introducing to show how often a team defense is generating pressure on the opposing quarterback. We'll be calculating Pressure Applied by dividing each team defense's sacks and quarterback hits by its total pass attempts faced. The same set of data will be provided and Pressure Allowed calculated for each team offense, to show which offenses are allowing pressure on their quarterback most often.
The tackle matchup table will include weekly averages of both rush and pass attempts faced, total offensive snaps faced and the percentage of rush vs pass attempts faced. It will also have a column titled Tackle Opportunity, a metric we introduced in mid-2007 to show how many plays a defense faced that could have ended in a solo tackle. We'll be calculating each team's Tackle Opportunity by adding all rush attempts, pass completions and sacks - the three plays that can end in a solo tackle outside of special teams and turnover plays. The same set of data will be provided and Tackle Opportunity calculated for each team's offense, to show which offenses are allowing the most tackle opportunity to opposing defenses.
We'll be highlighting the Pressure Applied/Allowed and Tackle Opportunity metrics with color codes showing the best and worst pass rush and tackle matchups. Expect to see lots of “good” and “bad” matchups early, as a relatively low sample size will show a lot of teams outside the historical standard deviations we'll be using to focus on the key matchups. While sample size will be a confounding issue during the early weeks, we'll still make every effort to show where the data looks meaningful. Without getting into a long discussion of statistics, we recognize that these metrics and tables will not be as predictive and reliable early in the season. We also acknowledge the noise within a set of unofficial statistics like solo tackles and quarterback hits. As the season progresses and the standard deviations of the data fall in line with prior seasonal averages, we expect that the data tables will be increasingly more reliable and useful.
You are very welcome to the fifth edition of what will be a season-long look at the best and worst matchups in the IDP landscape based on detailed, accurate spreadsheet data generated by Larry Thomas on a weekly basis.
For those of you who don’t know me, my name is Dave Larkin. I am a veteran IDP player and what some would call a diehard fan of this game of football that we all love so much.
Defense is my passion. Over the past few years, I have assimilated countless pages of data from various sources to improve my knowledge of the defensive side of the football. Each and every week I will study film from the previous week’s games and provide you with nuggets of wisdom that will lead you to a championship.
Clarity is a great thing, but the NFL is anything but as we enter the fifth week of action. Several upsets have littered the first four weeks of action, both on the field and in our fantasy lineups, as former studs turn to duds and old darlings of IDP fantasy football rise from the ashes.
Predicting this wild ride is folly, but with our data set growing week on week -- and a healthy dose of film to put the numbers into context -- we can capitalise on trends and maximise our points output.
Remember, getting to the dance is the main goal. We’re at the quarter pole; now is no time to take your eye off the ball.
So without further ado, let's get to the best and worst matchups of Week 5.
Pass Rushing Matchups to Exploit
Detroit front four vs. Buffalo
The clock has struck midnight on EJ Manuel's time as Buffalo’s starting quarterback; let the Kyle Orton Show begin! Orton hasn’t taken a regular season snap since Week 17 of last season and faces a baptism of fire against a consistent and mean Lions front four. Thus far, the Detroit front has pressured the passer on 17.5% of dropbacks, while the Bills have allowed pressure on 17.4% of dropbacks. This one looks like a one-sided affair with the potential for plenty of splash plays as Orton and the wayward Bills get thrown to the Lions.
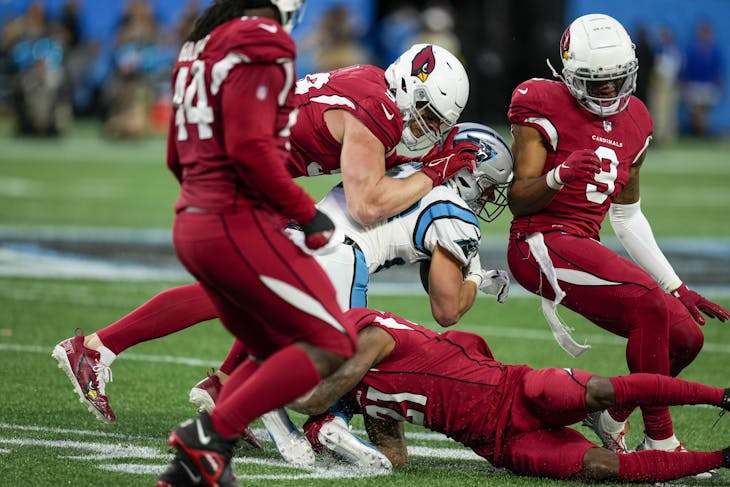
Denver front seven vs. Arizona
Denver's revamped front seven hasn’t quite hit the heights it is capable of just yet, but they should be raring to go off the bye. Expect better production and perhaps a few new blitzes thrown in to confuse Cardinals quarterback Drew Stanton and take away throws he is comfortable with. The Cardinals give up two sacks and 5.7 hits per game and home field advantage should give the Broncos that extra edge. Call this one my gut feeling of the week; play your Broncos.
Pass Rushing Matchups to Avoid
New England front seven vs. Cincinnati
Bill Belichick can shrug off the Kansas City debacle all he likes; there is a serious problem with the Patriots offense. The end result is that the defense will be under more pressure as the offense fails to put up enough points. That may not matter under the lights on Sunday, however, as the well-rested Bengals come to town. Cincinnati has given up pressure on only 1.1% of Andy Dalton’s dropbacks thus far, a staggering total that will be difficult to maintain. You can’t argue with the trends, though; New England's pass rush looked ordinary against Kansas City and perhaps lacks the impact players to trouble the stellar Cincinnati offensive line. While a bounce back may be a tempting rhetoric to buy into for the Patriots, the smart play here is to sit your Patriots if you can afford to.
Sack Opportunity Chart
| LEAGUE AVG | Team Defense | Team Offense | ||||||
| Pressure | QB | QB | Drop Backs | Pressure | QB Sacks | QB Hits | Drop | |
| Applied | Sacks | Hits | Faced | Allowed | Allowed | Allowed | Backs | |
| 2008 NFL Average | 12% | 2.02 | 4.13 | 34.3 | 12% | 2.02 | 4.13 | 34.3 |
| 2009 NFL Average | 13.3% | 2.15 | 4.71 | 35.4 | 13.3% | 2.15 | 4.71 | 35.4 |
| 2010 NFL Average | 12.7% | 2.21 | 4.59 | 35.9 | 12.8% | 2.21 | 4.59 | 35.9 |
| 2011 NFL Average | 13.1% | 2.32 | 4.75 | 36.3 | 13.1% | 2.32 | 4.75 | 36.3 |
| 2012 NFL Average | 12.8% | 2.29 | 4.75 | 37 | 12.8% | 2.29 | 4.75 | 37 |
| 2013 NFL Average | 13.5% | 2.53 | 5.13 | 38 | 13.5% | 2.53 | 5.13 | 38 |
| 2014 NFL Average | 12.5% | 1.96 | 4.63 | 37 | 12.5% | 1.96 | 4.63 | 37 |
| ARIZONA Cardinals | 7% | 1 | 2.7 | 38.3 | 16% | 2 | 5.7 | 35.3 |
| ATLANTA Falcons | 6.7% | 0.8 | 2.3 | 33.8 | 12.4% | 1.3 | 5 | 40.3 |
| BALTIMORE Ravens | 8% | 1 | 2.8 | 34.5 | 7.7% | 0.8 | 3 | 39 |
| BUFFALO Bills | 12.9% | 2.5 | 5.5 | 42.5 | 17.4% | 1.5 | 6 | 34.5 |
| CAROLINA Panthers | 13.2% | 2 | 5 | 38 | 15.7% | 2.5 | 6 | 38.3 |
| CHICAGO Bears | 12.5% | 2.3 | 4.3 | 34 | 10.4% | 2 | 4.3 | 41 |
| CINCINNATI Bengals | 14.3% | 2.3 | 7 | 49 | 1.1% | 0 | 0.3 | 29.3 |
| CLEVELAND Browns | 11.7% | 1.7 | 4.3 | 37 | 11.9% | 1.3 | 4 | 33.7 |
| DALLAS Cowboys | 12.8% | 1.3 | 4.8 | 37 | 9.5% | 2 | 3 | 31.5 |
| DENVER Broncos | 10.9% | 2.7 | 5 | 46 | 10.5% | 1 | 4 | 38 |
| DETROIT Lions | 17.5% | 2.5 | 6 | 34.3 | 15.1% | 2.8 | 6 | 39.8 |
| GREEN BAY Packers | 14.8% | 1.5 | 5 | 33.8 | 13.6% | 2.5 | 4.8 | 35 |
| HOUSTON Texans | 21.7% | 1.5 | 8.5 | 39.3 | 17.1% | 1 | 5 | 29.3 |
| INDIANAPOLIS Colts | 13.6% | 2 | 4.8 | 35 | 10.8% | 1.3 | 4.8 | 44 |
| JACKSONVILLE Jaguars | 10.9% | 3 | 4.8 | 43.8 | 22% | 5 | 8.8 | 39.8 |
| KANSAS CITY Chiefs | 12.5% | 3 | 4.5 | 36 | 13.5% | 3.3 | 4.8 | 35.3 |
| MIAMI Dolphins | 11.1% | 2.8 | 4.5 | 40.5 | 11.6% | 2.3 | 4.8 | 41 |
| MINNESOTA Vikings | 13.5% | 2 | 4.8 | 35.3 | 14% | 2 | 4.5 | 32.3 |
| NEW ENGLAND Patriots | 11.7% | 2.3 | 4 | 34.3 | 11.7% | 2.5 | 4.5 | 38.5 |
| NEW ORLEANS Saints | 10.8% | 1.3 | 4 | 37 | 8.4% | 1.3 | 3.5 | 41.5 |
| NEW YORK Giants | 15.2% | 2.3 | 5.3 | 34.5 | 9% | 1.5 | 3.3 | 36.3 |
| NEW YORK Jets | 17.5% | 3.5 | 7 | 40 | 15.8% | 2.3 | 5.8 | 36.5 |
| OAKLAND Raiders | 13.3% | 1 | 4 | 30 | 7.7% | 1 | 3 | 39 |
| PHILADELPHIA Eagles | 9.3% | 1.8 | 3.8 | 40.5 | 8.7% | 1.5 | 3.8 | 43 |
| PITTSBURGH Steelers | 9.9% | 1.8 | 3.8 | 37.8 | 10.4% | 2.8 | 4 | 38.5 |
| SAN DIEGO Chargers | 10.7% | 2.5 | 4 | 37.3 | 12.7% | 1.3 | 4.5 | 35.5 |
| SAN FRANCISCO 49ers | 9.8% | 1.3 | 3.8 | 38.3 | 12.7% | 2.5 | 4.3 | 33.5 |
| SEATTLE Seahawks | 12.9% | 1.7 | 5.3 | 41.3 | 9.6% | 2 | 3 | 31.3 |
| ST. LOUIS Rams | 12.9% | 0.3 | 3 | 23.3 | 15.8% | 2.3 | 6 | 38 |
| TAMPA BAY Buccaneers | 12.1% | 2.3 | 4.3 | 35.3 | 16.8% | 2 | 6 | 35.8 |
| TENNESSEE Titans | 10.1% | 2 | 3.5 | 34.8 | 16.4% | 2.8 | 5.8 | 35 |
| WASHINGTON | 17.7% | 2.8 | 6.3 | 35.3 | 13% | 2 | 5.3 | 40.5 |
Tackle Matchups to Exploit
Atlanta defenders at New York Giants
Defenses in the NFC South are quickly becoming the laughing stock of the rest of the league. Atlanta's demise on that side of the football is by no means a shock, but it doesn't have the look of improving anytime soon. Meanwhile, the Giants offense is headed the opposite direction under the guidance of first year offensive coordinator Ben McAdoo, who has restored seemingly retuned Eli Manning’s radar to focus on the short passing attack with quick releases. While Atlanta's cornerback duo has played solid football so far this season, Manning's completions between the numbers – and a steady dose of the ground game – should mean plenty of tackle opportunities for this reeling Falcons unit. The Giants offense has averaged 57 tackle opportunities per game, so this one is set up for success if you own any Atlanta players.
New York Jets defenders at San Diego
Methodical, efficient and unflappable, Philip Rivers has been simply on another level this season. The Chargers have a formula and it works perfectly for them. While that formula may need a little tweaking against a fearsome Jets run defense, Rivers should keep the Chargers offense on schedule to allow Rex Ryan's defenders plenty of tackle opportunities. Leading tacklers Demario Davis, David Harris and surprise Antonio Allen are excellent plays against an offense that averages 54.5 tackle opportunities per game.
Tackle Matchups to Avoid
San Francisco defenders vs. Kansas City
San Francisco may have surrendered three special teams touchdowns on Sunday against Philadelphia, but their stingy defense gave up a grand total of zero points. It was a highly encouraging sign and continued the trend of the Niners being a poor bet for tackle production. The NFL’s average tackle opportunity lies at 51.7; the Niners defense averages only 42.5 opportunities per game. The Chiefs’ performance on Monday night can’t be dismissed outright, but you get the sense that the Niners are rounding into form.
Tackle Opportunity Table
| LEAGUE AVG | TEAM Defense | TEAM Offense | ||||||||
| Tackle | Rush Attempts | Drop Backs | Offensive | Rush | Tackle Opps | Rush | Drop | Offensive | Rush | |
| Opportunity | Faced | Faced | Snaps Faced | Percentage | Allowed | Attempts | Backs | Snaps | Percentage | |
| 2008 NFL Average | 49.3 | 27.6 | 34.3 | 61.9 | 54.8% | 49.3 | 27.6 | 34.3 | 61.9 | 54.8% |
| 2009 NFL Average | 49.9 | 27.4 | 33.3 | 62.9 | 55.1% | 49.9 | 27.4 | 33.3 | 62.9 | 55.1% |
| 2010 NFL Average | 49.9 | 27.2 | 35.9 | 63.1 | 54.5% | 49.9 | 27.2 | 35.9 | 63.1 | 54.3% |
| 2011 NFL Average | 50 | 27.3 | 36.3 | 63.6 | 54.5% | 50 | 27.3 | 36.3 | 63.6 | 54.5% |
| 2012 NFL Average | 50.6 | 27.2 | 37 | 64.2 | 53.7% | 50.6 | 27.2 | 37 | 64.2 | 53.7% |
| 2013 NFL Average | 51.3 | 27.1 | 38 | 65 | 52.8% | 51.3 | 27.1 | 38 | 65 | 52.8% |
| 2014 NFL Average | 51.7 | 27.1 | 37 | 64.1 | 52.6% | 51.7 | 27.1 | 37 | 64.1 | 52.6% |
| ARIZONA Cardinals | 51 | 24.7 | 38.3 | 63 | 48.4% | 48 | 27 | 35.3 | 62.3 | 56.2% |
| ATLANTA Falcons | 56 | 33.8 | 33.8 | 67.5 | 60.3% | 52.8 | 25.5 | 40.3 | 65.8 | 48.3% |
| BALTIMORE Ravens | 47.5 | 25 | 34.5 | 59.5 | 52.6% | 54.8 | 29.8 | 39 | 68.8 | 54.3% |
| BUFFALO Bills | 54.3 | 24.8 | 42.5 | 67.3 | 45.6% | 48.3 | 27.8 | 34.5 | 62.3 | 57.5% |
| CAROLINA Panthers | 50 | 24.8 | 38 | 62.8 | 49.5% | 49.5 | 23.3 | 38.3 | 61.5 | 47% |
| CHICAGO Bears | 49.5 | 26 | 34 | 60 | 52.5% | 52 | 24.3 | 41 | 65.3 | 46.6% |
| CINCINNATI Bengals | 50 | 22.3 | 49 | 71.3 | 44.7% | 53.3 | 34 | 29.3 | 63.3 | 63.7% |
| CLEVELAND Browns | 54.3 | 29.3 | 37 | 66.3 | 54% | 52 | 30 | 33.7 | 63.7 | 57.7% |
| DALLAS Cowboys | 46.8 | 21.5 | 37 | 58.5 | 46% | 55 | 32.5 | 31.5 | 64 | 59.1% |
| DENVER Broncos | 58.7 | 27.3 | 46 | 73.3 | 46.6% | 49.3 | 23.7 | 38 | 61.7 | 48% |
| DETROIT Lions | 44.5 | 23.8 | 34.3 | 58 | 53.4% | 54.8 | 28.3 | 39.8 | 68 | 51.6% |
| GREEN BAY Packers | 59.8 | 38.3 | 33.8 | 72 | 64% | 44.8 | 20.8 | 35 | 55.8 | 46.4% |
| HOUSTON Texans | 52.3 | 26.3 | 39.3 | 65.5 | 50.2% | 51.8 | 32.3 | 29.3 | 61.5 | 62.3% |
| INDIANAPOLIS Colts | 44.8 | 24 | 35 | 59 | 53.6% | 61 | 30.5 | 44 | 74.5 | 50% |
| JACKSONVILLE Jaguars | 62 | 30.8 | 43.8 | 74.5 | 49.6% | 46.3 | 20 | 39.8 | 59.8 | 43.2% |
| KANSAS CITY Chiefs | 47.3 | 23.3 | 36 | 59.3 | 49.2% | 56 | 31.8 | 35.3 | 67 | 56.7% |
| MIAMI Dolphins | 53.8 | 28 | 40.5 | 68.5 | 52.1% | 54 | 28.5 | 41 | 69.5 | 52.8% |
| MINNESOTA Vikings | 52.8 | 28.3 | 35.3 | 63.5 | 53.6% | 49.3 | 29.3 | 32.3 | 61.5 | 59.4% |
| NEW ENGLAND Patriots | 51 | 29.3 | 34.3 | 63.5 | 57.4% | 50.5 | 26.3 | 38.5 | 64.8 | 52% |
| NEW ORLEANS Saints | 52.8 | 28 | 37 | 65 | 53.1% | 55 | 25 | 41.5 | 66.5 | 45.5% |
| NEW YORK Giants | 46.3 | 25 | 34.5 | 59.5 | 54.1% | 57 | 32.3 | 36.3 | 68.5 | 56.6% |
| NEW YORK Jets | 47.8 | 21.3 | 40 | 61.3 | 44.5% | 53.8 | 31 | 36.5 | 67.5 | 57.7% |
| OAKLAND Raiders | 58.8 | 36.8 | 30 | 66.8 | 62.6% | 43 | 18 | 39 | 57 | 41.9% |
| PHILADELPHIA Eagles | 57.8 | 33.3 | 40.5 | 73.8 | 57.6% | 49.8 | 24.3 | 43 | 67.3 | 48.7% |
| PITTSBURGH Steelers | 48.3 | 24 | 37.8 | 61.8 | 49.7% | 54 | 26.8 | 38.5 | 65.3 | 49.5% |
| SAN DIEGO Chargers | 47.3 | 21.5 | 37.3 | 58.8 | 45.5% | 54.5 | 29.3 | 35.5 | 64.8 | 53.7% |
| SAN FRANCISCO 49ers | 42.5 | 19.8 | 38.3 | 58 | 46.5% | 53.8 | 30.5 | 33.5 | 64 | 56.7% |
| SEATTLE Seahawks | 55 | 26 | 41.3 | 67.3 | 47.3% | 51.3 | 29 | 31.3 | 60.3 | 56.5% |
| ST. LOUIS Rams | 47.7 | 30.3 | 23.3 | 53.7 | 63.6% | 54.7 | 27 | 38 | 65 | 49.4% |
| TAMPA BAY Buccaneers | 58.5 | 31.3 | 35.3 | 66.5 | 53.4% | 43.5 | 21.3 | 35.8 | 57 | 48.9% |
| TENNESSEE Titans | 56 | 33 | 34.8 | 67.8 | 58.9% | 44.3 | 23.8 | 35 | 58.8 | 53.7% |
| WASHINGTON | 50.3 | 26.8 | 35.3 | 62 | 53.2% | 55 | 27.5 | 40.5 | 68 | 50% |
Best of luck with Week 5 and make sure to check back next week for more matchup analysis.
If you have any further questions or tricky line-up decisions you need advice with, please drop me a line at larkin@footballguys.com, or if you prefer you can tweet me @davlar87.